
Case Studies › Revive MD

How we took Revive MD's conversion rate from below 2% to a 4.5% peak

× PMDIGITAL
DESIGN
4.5%
Peak sitewide conversion rate, up from below 2%
+5%
Revenue per visitor from the search bar, at 82% confidence
+11%
Conversion rate, subscription first in the buy box, at 92% probability
revivesups.com
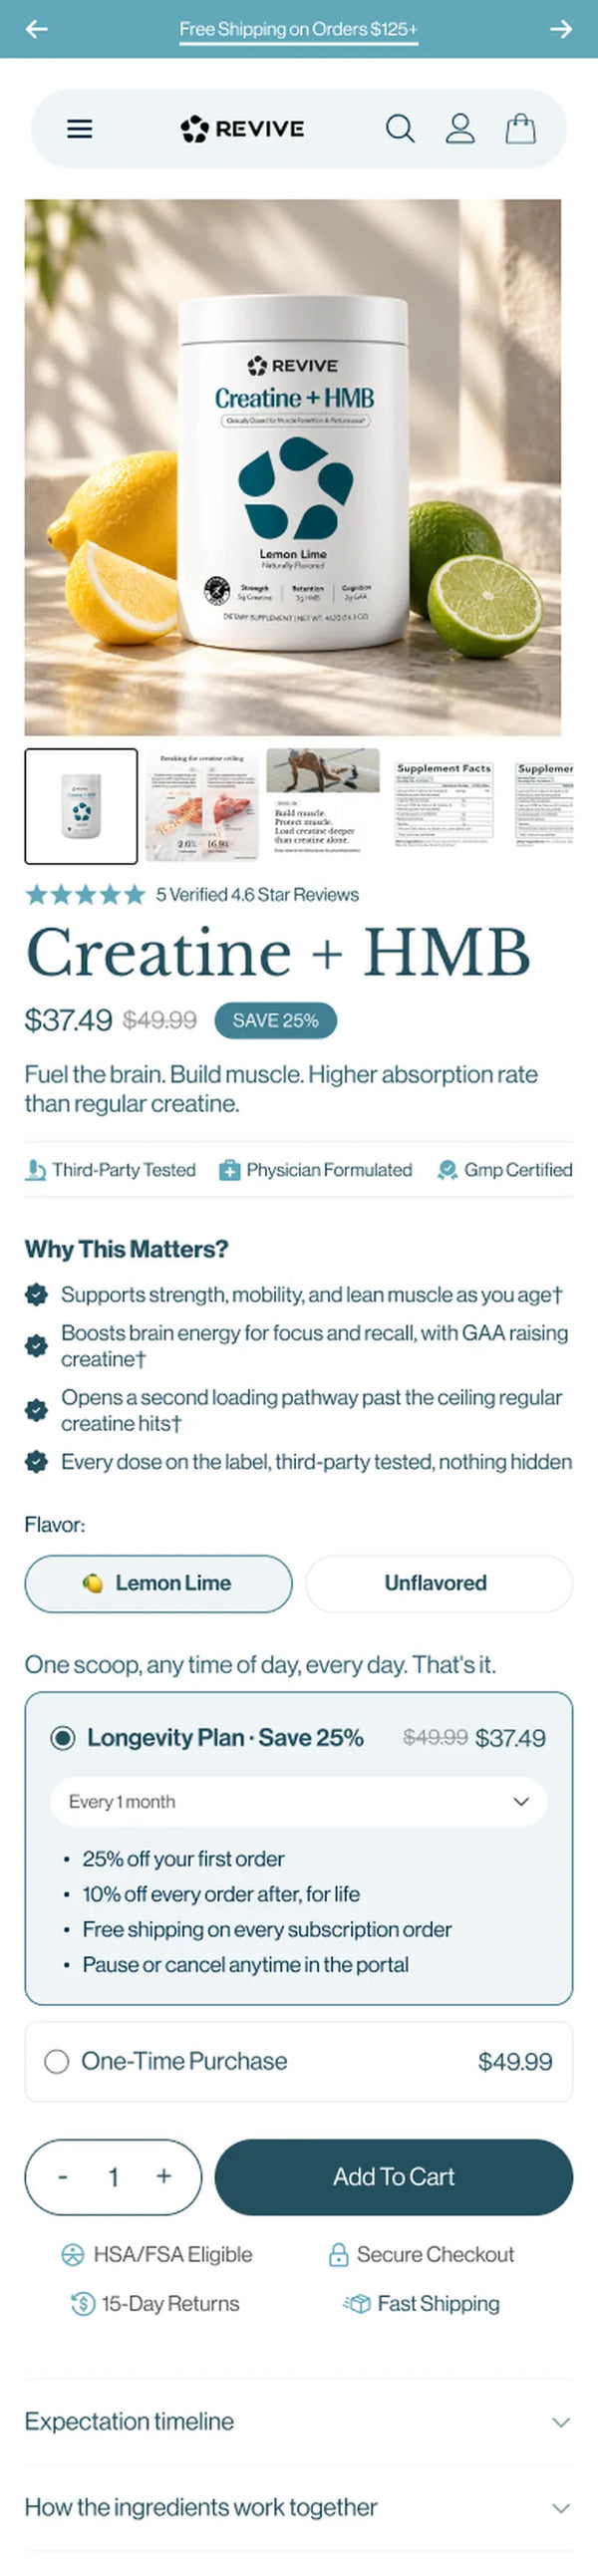
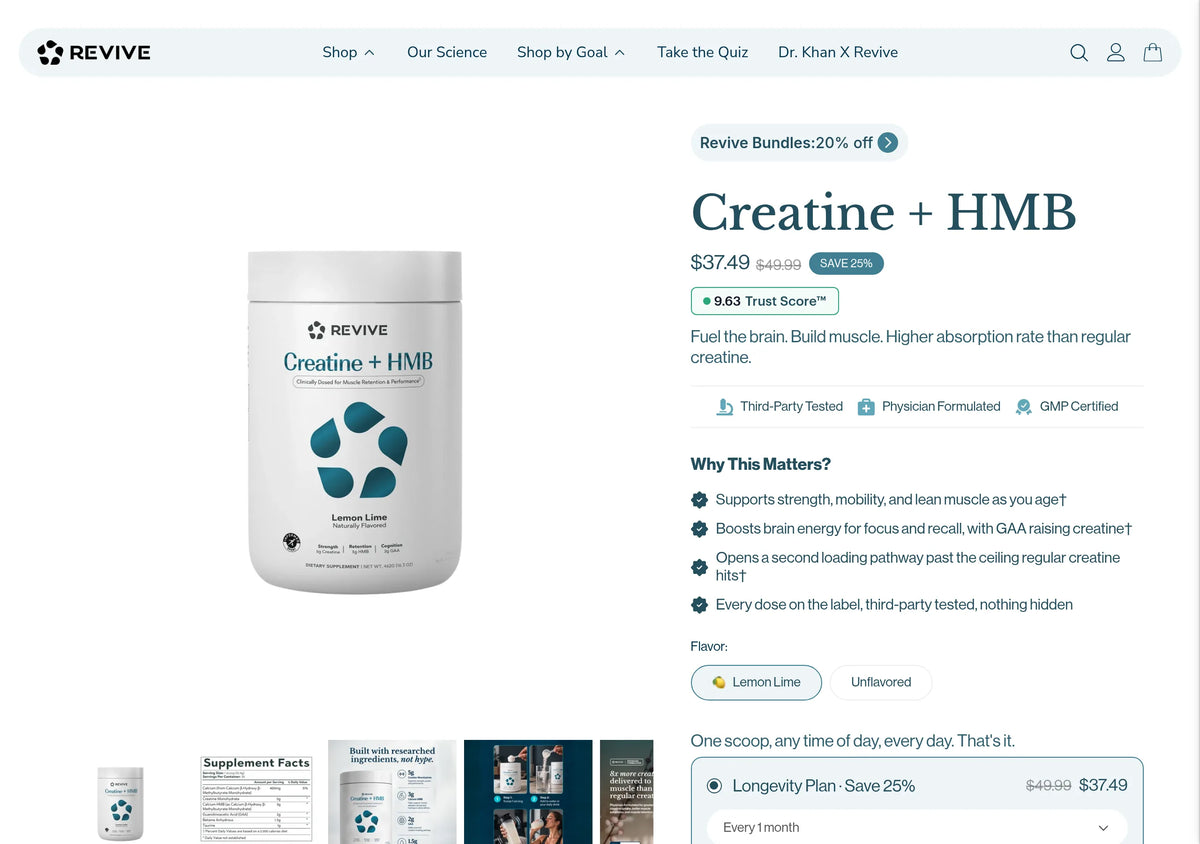
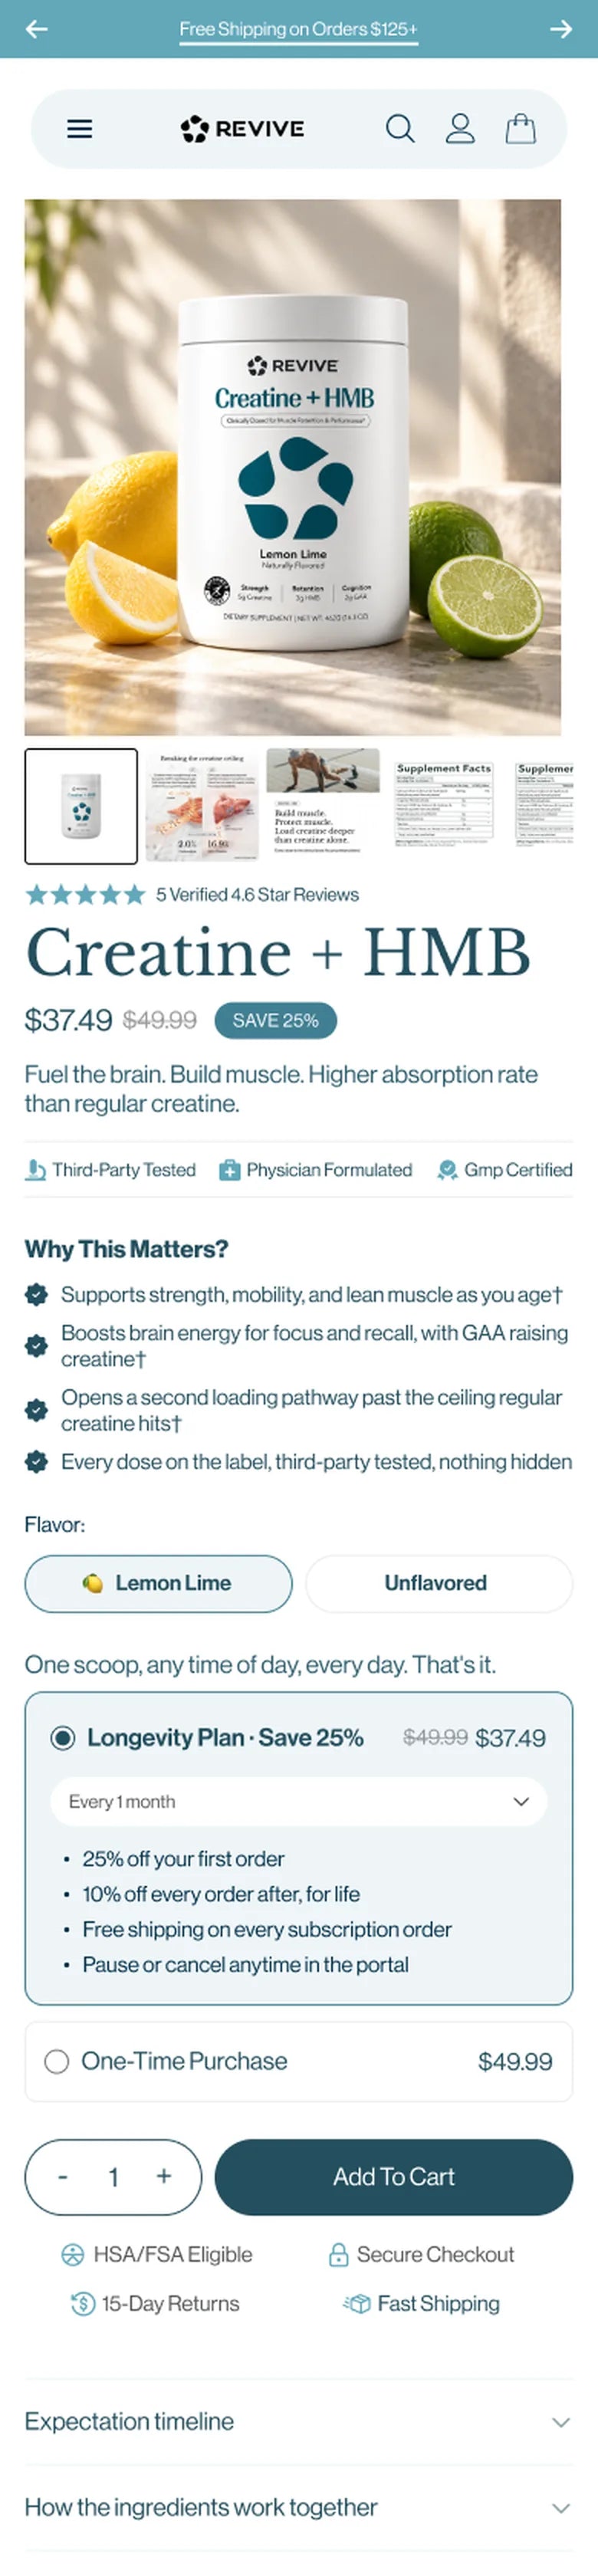
Revive MD Creatine + HMB product page on mobile, with subscription first in the buy boxRevive MD Creatine + HMB product page on desktop, with subscription first in the buy box
Client
Revive MD
Industry
Doctor formulated supplements
Platform
Shopify · Intelligems
Engagement
CRO & Scale Plan, October 2025 to present
The challenge

Conversion was falling, and bot traffic was hiding the real numbers.

When we started, conversion was down 17% on the year before. In November 2025 we found a second problem. Bot or click farm traffic from China was landing on the blog, with zero purchases and zero email sign ups. It dragged conversion rate and revenue per visitor down and fed the ad platforms the wrong audience. Black Friday was weeks away, the store was running a heavy stack of apps, including three separate cookie consent tools on mobile, and the brand wanted to move from a bodybuilding audience to a wider wellness and longevity customer.

The buy box with subscription first, on a Revive MD product page
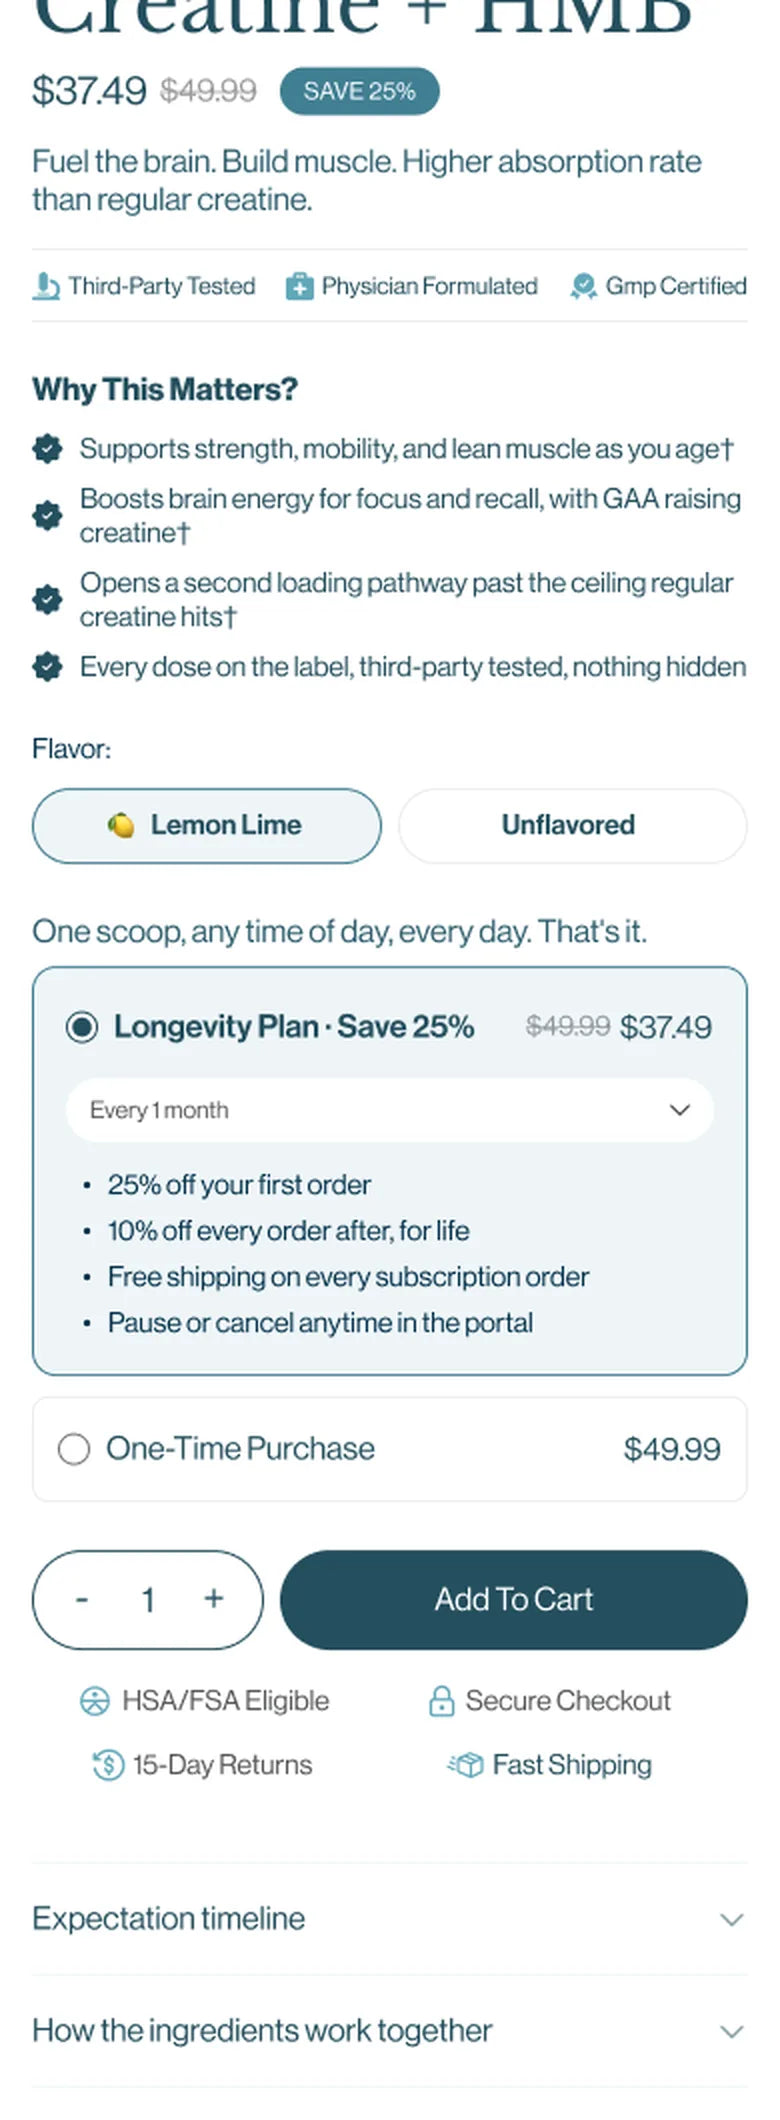
Revive MD buy box with the subscription option first and pre selected
Revive MD on mobile
Revive MD Creatine + HMB product page on mobile, with subscription first in the buy box
  1. 01Friction point

    Can we trust the numbers?

    Bot traffic from China was counted as visitors, which pushed conversion rate and revenue per visitor down.

  2. 02Friction point

    Will the store hold up for Black Friday?

    A sitewide 40% sale had to go live on a theme carrying a heavy app stack.

  3. 03Friction point

    One time or subscribe?

    The buy box asked shoppers to weigh two options, instead of giving them a clear default.

  4. 04Friction point

    Where is the product I came for?

    People who already knew the product needed a faster way to find it than browsing.

The research

What we kept coming back to.

We started with a full audit, a demographic and voice of customer review, and a look at how traffic actually moved through the store. Later came a quiz funnel analysis, heatmap and scroll depth reports, a BOGO landing page analysis and a test learnings deck. Each one fed the testing roadmap.

  1. PM Digital traffic audit, November 2025
    • What we foundBlog traffic from Chinese IP addresses brought zero purchases and zero email sign ups, and looked like bots or a click farm.
    • What we didBlock it first, so every report and test after it reads real customers.
  2. Client brief, October 2025
    • What we foundConversion was down 17% year on year when the partnership began.
    • What we didPrioritise tests that help more people complete an order, not only tests that raise basket size.
  3. Test learnings deck, July 2026
    • What we foundTests that made an existing decision easier to act on won. Tests that summarised or reframed the case for buying lost.
    • What we didRevive MD customers buy by working through the evidence. Keep it, and remove the taps, scrolls and choices around it.
The strategy

Stabilise, rebuild, then test the offer.

We worked in that order on purpose. There is no point testing a buy box while bots are counted as visitors, or while the theme breaks every time someone edits it. So we cleaned the traffic and got Black Friday live first, rebuilt the theme and product page template second, and then put offers, subscriptions, search, checkout and landing pages through A/B tests on Intelligems. Every test ran against the original at the same time, and we show each result at the confidence it actually reached.

  • The goal was notHow do we get more traffic?
  • It wasHow do we turn the traffic Revive MD already has into more orders and more subscribers?
Where we worked in the funnel
  1. 1TrafficBot traffic blocked
  2. 2Theme and navigationRebuilt, with Shop by goal
  3. 3Search+5% revenue per visitor
  4. 4Buy box+11% conversion rate
  5. 5Checkout+2.5% completion
  • How we worked
  • Stabilise
  • Rebuild
  • Offers
  • Subscriptions
  • Funnels
  • Testing

CRO Brain and PMD Cortex AIThis is our CRO & Scale Plan. A full pod runs it, with strategy, copy, design and QA on every test, and our engineers on dev, managing the bots. Every test, report and customer insight goes into Revive MD's CRO Brain, our running record of what their customers respond to, and PMD Cortex AI, our own AI system, learns from every test we run, so each new test starts from what has already worked or failed.

How the partnership grew

Stabilise, rebuild, then test and optimise.

  1. October to November 2025

    Stabilise

    Audit and customer research. Bot traffic from China blocked. The Black Friday theme and 40% sitewide sale built and live on time.

  2. December 2025 to June 2026

    Rebuild

    A new theme live in February 2026 with a Shop by goal menu and nine updated product pages, then one product page template rolled out across the best sellers. Offers and landing pages fixed and rebuilt.

  3. 2026 onwards

    Test and optimise

    Subscription, search, checkout and product page tests, the 25% first month subscription offer, quantity tiers, new landing pages and the rebrand build.

The work

What we changed, and what each change did.

01 · Traffic · bot traffic from China

Clean the traffic before you read a single test.

In November 2025 the analytics showed a surge of traffic from Chinese IP addresses landing on a blog page, with zero purchases and zero email sign ups. We flagged it as bot or click farm traffic, and our developer blocked traffic from China the next day, ahead of Black Friday. We also flagged the three separate cookie consent tools showing pop ups on mobile, and recommended cutting them back.

Next dayTraffic from China blocked after we flagged it
0Purchases from that traffic
0Email sign ups from it
  • What changedTraffic from China blocked at the store, so reports and tests count real shoppers.
  • HypothesisIf bot visits stop being counted, conversion rate and revenue per visitor will show what real customers are doing, and the ad platforms will learn from real buyers.
  • Why it wonBad traffic made the store look worse than it was. Clearing it first meant every report and test after it measured real customers.
02 · Theme · rebuild and fixes

Rebuild the theme so the team can change it without breaking it.

We built the Black Friday sale theme in November 2025, then rebuilt the foundations. In February 2026 a new theme went live with a new main menu built around Shop by goal, and updated product pages for Kidney, Liver, Magnesium Glycinate, Omega 3, the Essential Vitamins Pack, Digest Aid, GI+, Women's Health and Men's Health. We then moved the product pages onto one template, rolled it out across the best sellers, and fixed the offers and cart logic so the deals worked as promised.

9Product pages updated in the first release
1Product page template for the best sellers
  • What changedA new theme and main menu, and one product page template for the catalogue.
  • HypothesisIf every product page shares one clean template, the store loads and behaves the same everywhere, and each later test changes one thing, not ten.
  • Why it wonTests are only as good as the pages they run on. The rebuild is what made the later tests readable.
03 · Buy box · subscription first

Make subscription the default, not a second option.

We moved the subscription option to the top of the buy box and pre selected it, with one time purchase underneath. Shoppers stopped weighing two options and took the default. Conversion rate rose 11% at a 92% probability, and subscription orders per visitor rose 13%. Revenue per visitor rose 3% after the smaller first basket that subscription often brings. Returning visitors spent 25% more per visit. Earlier, a one tap subscription switch in the mobile sticky add to cart raised the share of orders on subscription by 39%. Revenue per visitor dipped 13% in the short term, because the subscription discount lands on the first order, and no probability was reported, so we do not count that one as a win. In August 2026 the 25% first month subscription offer became the default way to buy.

+11%Conversion rate, at 92% probability
+13%Subscription orders per visitor
+3%Revenue per visitor
+39%Share of orders on subscription, sticky switch test
  • What changedSubscription first and pre selected, with one time purchase as the alternative underneath.
  • HypothesisIf we move the subscription option to the first position, with one time purchase below, more shoppers will subscribe and revenue per visitor will rise, because people tend to take the first, pre selected option.
  • Why it wonThe lift came from a simpler decision, not a new discount. We do not call this a settled winner, because 92% is below the 95% threshold we usually want. The estimated extra revenue was $5,000 to $8,000 a month.
The buy box with subscription first, on mobile
Revive MD buy box with the subscription option first and pre selected

Estimated at $5,000 to $8,000 a month in extra revenue, based on the test result.

04 · Sitewide · search bar

Help people who already know the product get to it.

A more visible search bar helped people who already knew what they wanted reach it faster. Revenue per visitor rose 5% and conversion rate 5%, with a steady lead for three weeks at 82% confidence. Returning visitors converted more. The team asked us to push the change live the same day.

+5%Revenue per visitor, at 82% confidence
+5%Conversion rate
3 weeksSteady lead during the test
  • What changedA more visible search bar, so known products are easier to reach.
  • HypothesisIf high intent shoppers can find a specific product faster, more of their visits will end in an order.
  • Why it wonThe result was consistent, but 82% confidence is not enough to call it a settled winner. It is a supporting result, and it was shipped at the team's request.

Projected at around $8,500 a month in extra revenue, based on the test result.

05 · Checkout · reviews at the payment step

Answer the last doubt at payment.

We placed real customer reviews under the order total at checkout. Over 28 days, checkout completion rose from 63.2% to 64.8%, a 2.5% lift, and average order value held at $91. Revenue per checkout visitor rose 2.5%. Completion on mobile rose 3%, and visitors who came direct spent 13% more per visit. No probability was reported for this test, so we show the duration and the result without calling it a winner.

+2.5%Checkout completion, over 28 days
+2.5%Revenue per checkout visitor
HeldAverage order value, at $91
+3%Mobile checkout completion
  • What changedCustomer reviews placed under the order total at the payment step.
  • HypothesisIf we show customer reviews directly below the order total in checkout, more visitors will finish paying, because the product decision is already made and the remaining hesitation is about trusting the brand.
  • Why it wonMore people finished paying, and baskets did not get bigger, which is what a trust element should do. With no probability figure, we treat this as a directional result over a clear 28 day window.
06 · Offers and landing pages

Test the offer, not only the page.

Alongside the tests we built the landing pages Revive MD's paid traffic lands on, including the BOGO offer pages, Liver, Magnesium Glycinate, Cortisol, Creatine and Longevity pages, a Sleep page testing tiered discounts, and the Black Friday 2026 stack event page. Our BOGO page analysis showed strong add to cart intent but a lower conversion rate than the top product pages, and that the education sections below the best sellers were getting no clicks. Two offer tests lost clearly and were never shipped, and they are listed below. The pattern was clear: offers that hid or reframed the evidence lost, and offers that made a bigger order easier are where the next gains are.

  • What changedDedicated offer landing pages, a tiered discount test on Sleep, and quantity tiers on the product pages.
  • HypothesisIf product pages make a bigger order easy, order value will rise without a deeper discount, because the Quick View test showed this customer buys more when it is simple to do.
Why it won

What made the difference, section by section.

Each row links to the test above. The figure is the lead result from the test report, with its confidence.

  1. 101 · Traffic · bot traffic from China

    Clean the traffic before you read a single test.

    Bad traffic made the store look worse than it was. Clearing it first meant every report and test after it measured real customers.

    Next dayTraffic from China blocked after we flagged it
  2. 202 · Theme · rebuild and fixes

    Rebuild the theme so the team can change it without breaking it.

    Tests are only as good as the pages they run on. The rebuild is what made the later tests readable.

    9Product pages updated in the first release
  3. 303 · Buy box · subscription first

    Make subscription the default, not a second option.

    The lift came from a simpler decision, not a new discount. We do not call this a settled winner, because 92% is below the 95% threshold we usually want. The estimated extra revenue was $5,000 to $8,000 a month.

    +11%Conversion rate, at 92% probability
  4. 404 · Sitewide · search bar

    Help people who already know the product get to it.

    The result was consistent, but 82% confidence is not enough to call it a settled winner. It is a supporting result, and it was shipped at the team's request.

    +5%Revenue per visitor, at 82% confidence
  5. 505 · Checkout · reviews at the payment step

    Answer the last doubt at payment.

    More people finished paying, and baskets did not get bigger, which is what a trust element should do. With no probability figure, we treat this as a directional result over a clear 28 day window.

    +2.5%Checkout completion, over 28 days
Honest accounting

Not every test is a result we would ship on confidence alone.

We only treat a test as a clear win when the new version beats the original with high confidence, typically 95%. No single test here reached that bar, so every result is shown with the probability or duration we actually have. By July 2026 we had read 13 tests: three wins we rolled out, seven that fell short and were caught before rollout, and three still to call. These are the ones worth knowing about.

13Tests run
3Winners
7Flat or negative, documented
  1. Lost

    Price per serving framing

    Conversion rate fell 21% at 98% confidence. Not shipped.

  2. Lost

    Quick View on collection cards

    Conversion rate fell 25% at 99% confidence, though order value rose 10%. Not shipped, and the order value signal shaped the quantity tier tests.

  3. Directional

    Longevity product pages on mobile

    Revenue per visitor rose 15% and conversion rate 8% over 39 days, at 73% confidence. We recommended implementing, but we do not count it as a win at that confidence.

  4. Too thin to publish

    Creatine product page image gallery

    The test ran on very low traffic and the report did not give a usable probability, so it is not counted.

The result

Conversion rate from below 2% to a 4.5% peak.

With the bot traffic counted, Revive MD's sitewide conversion rate read below 2%. After we cleaned the traffic, rebuilt the theme and sorted the subscription offer and bundles, it peaked at 4.5%. That is a before and after reading of the store's own analytics, not an A/B test, and part of it comes from removing bad traffic rather than adding sales. The tests on top were measured against the original at the same time. Subscription first in the buy box lifted conversion rate by 11% at 92% probability, a more visible search bar lifted revenue per visitor by 5% at 82% confidence, and reviews at checkout lifted completion by 2.5% over 28 days. Projected figures are based on the test result, not revenue already banked.

4.5%Peak sitewide conversion rateUp from below 2%, before and after reading
+5%Revenue per visitor, at 82% confidenceSearch bar test
+11%Conversion rate, at 92% probabilitySubscription first in the buy box
+2.5%Checkout completion, over 28 daysReviews at the payment step
MetricBeforeAfter
Sitewide conversion rateBelow 2%4.5% peak
  • Bot traffic from China blocked
  • New theme and product page template
  • +11% conversion at 92% probability
  • +5% revenue per visitor at 82% confidence
Implementation status

The bot block, the new theme, the product page template, the search bar and the subscription first buy box are live. The 25% first month subscription offer is now the default way to buy. Winning tests are being written into the rebrand build, due to launch in January 2027.

Revive MD product page, with subscription first in the buy box
What comes next

Where the next gains are.

The partnership is still running. Next come quantity tiers, more landing pages and the rebrand, and each new result is only counted once it reaches a confidence we are happy to stand behind.

  1. Quantity tiers on the product pages

    Quick View showed this customer will buy more when it is easy. The quantity tier tests build on that.

  2. Carry the winners into the rebrand

    The rebrand is still under way. Anything that holds up should be built into that new site, not left behind.

  3. Help first time visitors as well

    Returning visitors moved most on the buy box. First time shoppers still need a clearer reason to commit.

Work with us

Is bad traffic or a fragile theme hiding what your store can really do?

We clean the data, fix the foundations and then test the offer, with a full pod doing the work. You keep what holds up.

Plans and pricing

Work with PM Digital.

Book a call with Paddy, our founder. It's a chat to see where the brand is and what it needs. We'll do an audit only if it's needed.

  • CRO sprint £4,000 one-off
  • The CRO & Scale Plan £6,000 / month
  • CRO and creative From £10,000 / month

The 90-day guaranteeIf we don't get you a winning test in 90 days, we work the next 30 free until we do.See terms